Using Covid-19 to Explain Community Detection (Part II)
A simple explanation of the Louvain algorithm
If you haven’t read it already, knock out Part I real quick. It provides more context and motivation. As a reminder, here’s the example we’re interested in:
Imagine you’re leading the COVID-19 response team. Trump comes up to you and says, “Hey. We’ve just secured the funds to hire between 10,000 and 100,000 Community Liaisons. Each of these Liaisons will represent a group of Americans who are likely to transmit coronavirus to one another. You need to figure out which people are most likely to give coronavirus to which people and make sure that each American has one and only one Community Liaison.” What do you do?
The Louvain algorithm can help us build the communities described in this example.
Modularity
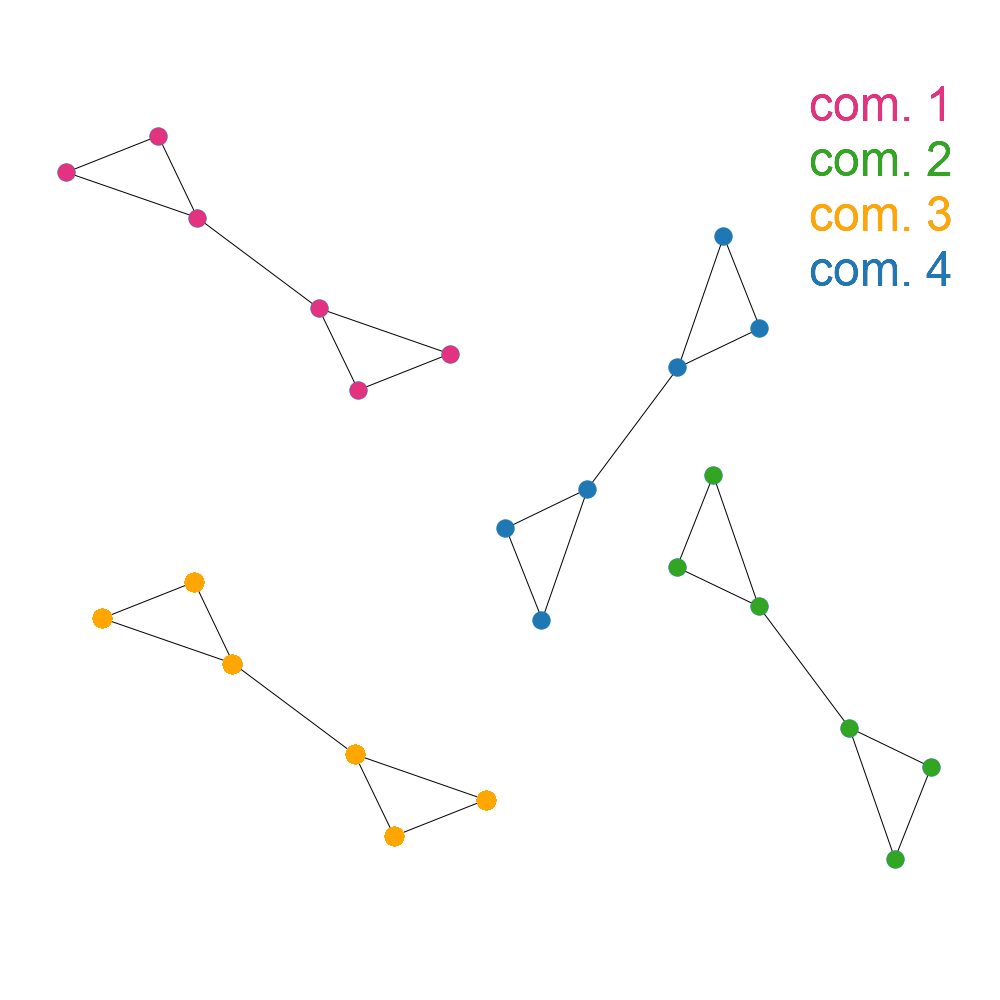
Our goal is to make our graph as well-clustered, or “modular”, as possible. What does “modular” mean? A graph is fully modular if all of the edges for the nodes in each community exclusively connect to other nodes in that same community. This graph is fully modular:
On the other hand, a graph isn’t very modular if the edges for a node are as likely to lead to a node in another community as they are to lead to a node in the same community. For example:
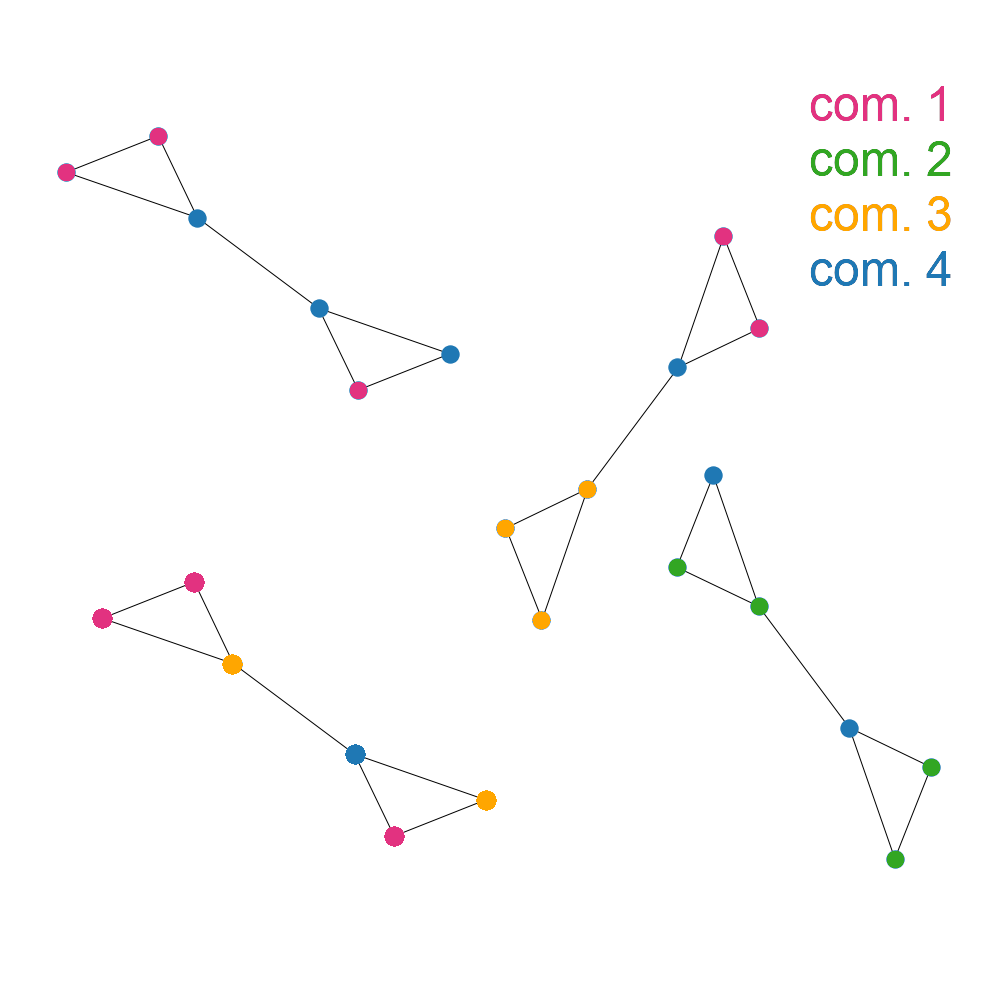
We call this measurement of the number of edges within communities compared to the number of edges between communities the “modularity” of a graph. I’m not going to include the equation here, but if you want the next level of detail Wikipedia has a great description.
The Louvain algorithm assigns nodes to communities in such a way that the modularity of the graph is as high as possible.
Stage 1
We begin by placing each node in the graph in its own community. Then, for an individual node, we measure the graph’s modularity with the node no longer belonging to its own community but instead belonging to the same community as one of its neighbors. If we find one or more neighbors where this change of community increases the modularity, we reassign the node to the community that increases the modularity the most. If none of the potential community moves increases modularity, then the node remains in its original community.
Once we’re done with this process for a single node, we perform it sequentially on every other node in the graph. This process is repeated until no movement for any node results in a modularity increase. It’s acceptable and expected to complete as many full cycles as needed as long as at least one node switches communities in a cycle.
Stage 2
Once stage 1 is complete, we have communities of multiple nodes. Stage 2 creates a new graph by turning each community into a single node. All of the links between the original nodes of this new community are now summed together to create a single edge connecting the community to itself. Similarly, all of the edges running from nodes in this community to a second given community are summed into a single edge as well. Once the new graph is formed, no two communities will have more than a single edge connecting them.
Repeat
This new graph can now be directly fed back into stage 1 of the algorithm. Stages 1 and 2 are repeated until no changes occur and the maximum modularity for the graph has been found.
The Takeaway
It might seem like I glossed over a lot here. Shouldn’t a high-quality data science algorithm be much more complicated than that? While I did leave out some detail, you can read the original paper to see that even a full explanation isn’t much more complicated, mostly just a couple of equations. One of the reasons Louvain has been so popular is because its simplicity makes it both easy to understand and very fast.
Now that you understand when and why to use Louvain, as well as how it works, you can also try it out for yourself in a couple of lines of Python:
import community as community_louvain
import networkx as nx

# Make graph
G = nx.erdos_renyi_graph(30, 0.05)

# Find communities
partition = community_louvain.best_partition(G)
There are at least two nice packages, python-louvain and louvain-igraph, that are very easy to try out, so give them a whirl.
Finally (and hopefully it doesn’t feel like too much of a bait-and-switch), as of 2019, the Louvain algorithm is no longer “state-of-the-art” and has been largely superseded by the Leiden algorithm, which is based on the Louvain algorithm but is “considerably more complex”.
We’ll save Leiden for another time.